
Performance Tab Overview: Analyze website speed with Chrome DevTools.
2025 Chrome DevTools Performance Tab Tutorial: Fix Speed Bottlenecks Fast
Struggling with a slow website? The Chrome DevTools Performance Tab is your go-to tool for diagnosing and resolving speed issues. In this comprehensive 2025 Chrome DevTools Performance Tab tutorial, we’ll guide you through every step of using this powerful tool to identify and fix website speed bottlenecks. From analyzing performance profiles to optimizing images and JavaScript, this guide is designed for beginners and seasoned developers alike.
At Brand Nexus Studios, we’re passionate about building high-performance websites that rank well and convert. Let’s unlock the full potential of Chrome DevTools to make your site lightning-fast!
Why Website Speed is Critical in 2025
In 2025, website speed is more important than ever. Slow-loading pages frustrate users, increase bounce rates, and hurt your SEO rankings. Google’s Core Web Vitals—metrics like Largest Contentful Paint (LCP), First Input Delay (FID), and Cumulative Layout Shift (CLS)—prioritize fast, responsive sites. A delay of just a few seconds can cost you visitors and revenue.
Fortunately, the Chrome DevTools Performance Tab provides deep insights into what’s slowing your site down. By identifying bottlenecks, you can make targeted improvements that enhance user experience and boost your search engine rankings. Let’s explore how this tool works and how you can use it effectively.
Need professional help with website optimization? Brand Nexus Studios specializes in creating fast, SEO-friendly websites that drive results.
What is the Chrome DevTools Performance Tab?
The Chrome DevTools Performance Tab is a diagnostic powerhouse that records and analyzes your website’s runtime performance. It captures everything from page load times to JavaScript execution and rendering tasks, helping you pinpoint bottlenecks that affect speed and interactivity.
For example, if your site takes too long to become interactive, the Performance Tab can reveal whether a heavy JavaScript file or a slow server response is to blame. Armed with this data, you can optimize your site for better performance and user satisfaction.
How to Use the Chrome DevTools Performance Tab: Step-by-Step
Ready to dive into this Chrome DevTools Performance Tab tutorial? Follow these steps to record and analyze a performance profile:
- Open Chrome DevTools: Right-click on your webpage and select “Inspect,” or use the shortcut
Ctrl+Shift+I(Windows) orCmd+Option+I(Mac). - Go to the Performance Tab: In the DevTools panel, click the “Performance” tab to access the profiling tools.
- Enable Advanced Settings: Check options like “Screenshots” and “Memory” for a more detailed analysis.
- Start Recording: Click the circular “Record” button or press
Ctrl+E. Interact with your site (e.g., scroll, click buttons, or navigate) to simulate real user behavior. - Stop Recording: Click “Stop” to end the session and generate the performance profile.
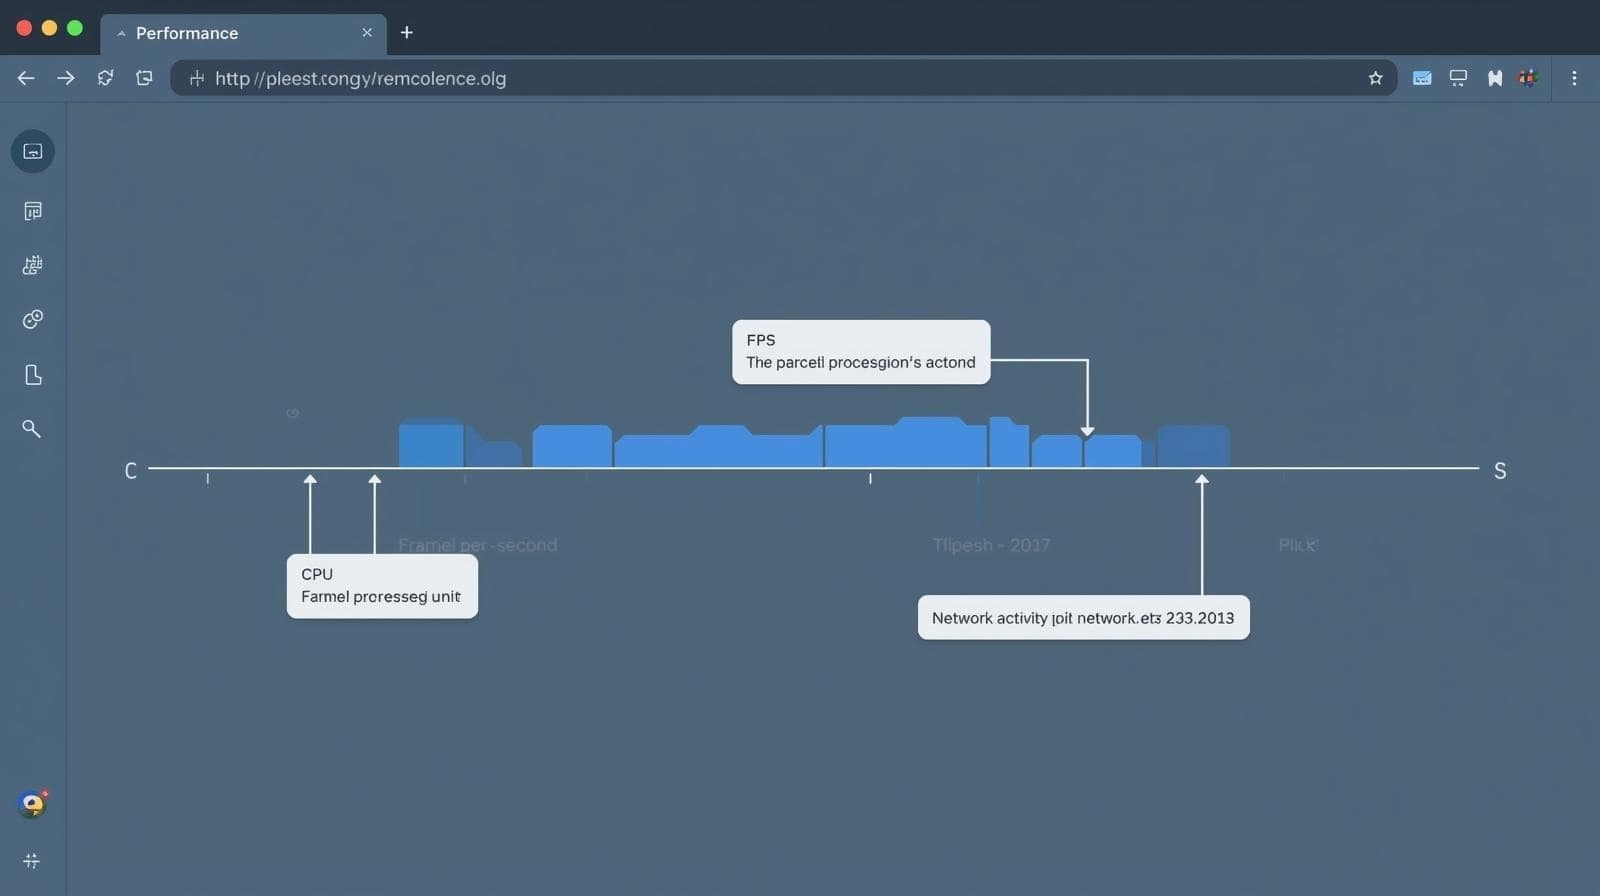
- Analyze the Results: Review the timeline, which includes FPS, CPU usage, network activity, and more.
This process helps you capture a snapshot of your site’s performance, revealing areas for improvement.

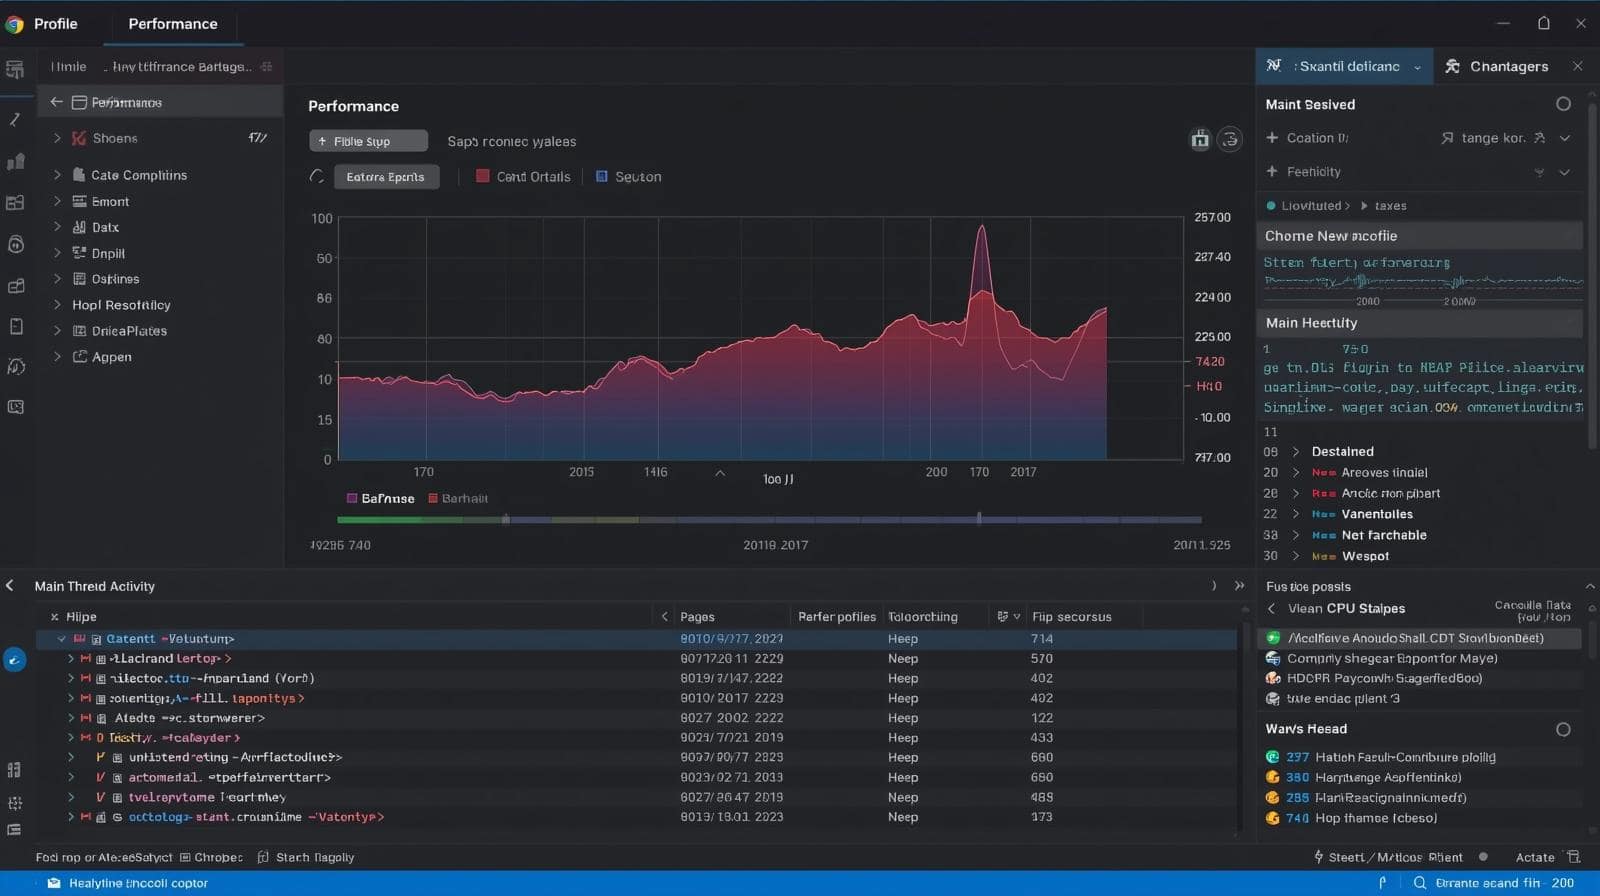
Breaking Down the Performance Tab Interface
The Performance Tab can seem complex at first, but its interface is designed to provide actionable insights. Here’s a detailed look at its key components:
- Timeline Overview: Displays FPS (frames per second), CPU usage, and network activity over time. Red bars indicate potential bottlenecks.
- Main Thread: Shows JavaScript execution, rendering, and painting tasks. Long tasks here often indicate performance issues.
- Network Panel: Lists resource loading times, such as images, scripts, and fonts, helping you identify slow assets.
- Summary Tab: Offers a high-level overview of bottlenecks, including long tasks and resource-heavy elements.
- Interactions: Tracks user interactions like clicks or scrolls, correlating them with performance impacts.
By focusing on these sections, you can zero in on specific issues, such as a JavaScript function blocking the main thread or a large image slowing down page load.
Common Website Speed Bottlenecks and How to Fix Them
Using the Chrome DevTools Performance Tab, you can identify a range of speed bottlenecks. Below, we’ll cover the most common issues and provide actionable solutions to optimize your site.
1. Unoptimized Images
Large, unoptimized images are one of the biggest culprits behind slow websites. The Performance Tab’s Network panel highlights images with long loading times, often due to excessive file sizes.
Solutions:
- Compress Images: Use tools like TinyPNG, Squoosh, or ImageOptim to reduce file sizes without sacrificing quality.
- Use Modern Formats: Convert images to WebP or AVIF, which offer superior compression compared to JPEG or PNG.
- Implement Lazy Loading: Add the
loading="lazy"attribute to defer offscreen images, reducing initial load times. - Resize Images: Serve images at the correct dimensions to avoid unnecessary scaling by the browser.
By optimizing images, you can significantly improve your site’s Largest Contentful Paint (LCP) score, a key Core Web Vital.

2. Heavy JavaScript Execution
JavaScript can block the main thread, delaying interactivity and increasing First Input Delay (FID). The Performance Tab’s Main Thread section shows long-running tasks that may be slowing your site.
Solutions:
- Minify JavaScript: Use tools like UglifyJS or Terser to reduce file sizes.
- Code Splitting: Break large JavaScript files into smaller chunks, loading only what’s needed for the current page.
- Defer Non-Critical Scripts: Use
deferorasyncattributes to prevent scripts from blocking rendering. - Use Web Workers: Offload heavy computations to background threads to keep the main thread free.
Optimizing JavaScript ensures your site responds quickly to user interactions, improving both performance and user experience.
3. Excessive or Unoptimized CSS
Complex CSS rules or unused styles can slow down rendering, increasing the time it takes for your page to paint. The Performance Tab’s Rendering section highlights these issues.
Solutions:
- Remove Unused CSS: Use tools like PurgeCSS or Coverage in Chrome DevTools to eliminate unused styles.
- Minify CSS: Combine and compress CSS files to reduce HTTP requests and file sizes.
- Use Critical CSS: Inline critical above-the-fold styles to prioritize initial rendering.
- Avoid Complex Selectors: Simplify CSS selectors to reduce parsing time.
Streamlined CSS improves rendering speed, contributing to a better Cumulative Layout Shift (CLS) score.
4. Slow Server Response Times
A slow server can bottleneck your entire site, delaying the delivery of critical resources. The Network panel in the Performance Tab shows server response times for each asset.
Solutions:
- Optimize Hosting: Choose a high-performance hosting provider like Brand Nexus Studios to ensure fast server responses.
- Use a CDN: A Content Delivery Network (CDN) like Cloudflare or Akamai serves assets from servers closer to your users, reducing latency.
- Enable Caching: Use browser and server-side caching to store frequently accessed resources, minimizing server requests.
- Optimize Backend Code: Streamline database queries and server-side scripts to improve response times.
Faster server responses lay the foundation for a high-performing website.

5. Render-Blocking Resources
Render-blocking resources, like CSS or JavaScript loaded in the page’s <head>, can delay the first paint. The Performance Tab’s Timeline shows when these resources block rendering.
Solutions:
- Defer CSS and JavaScript: Move non-critical resources to the bottom of the page or use
defer/async. - Inline Critical Resources: Inline small CSS or JavaScript needed for above-the-fold content.
- Reduce HTTP Requests: Combine files and use modern protocols like HTTP/2 to speed up resource delivery.
Eliminating render-blocking resources improves your site’s Time to First Byte (TTFB) and overall load time.
Advanced Techniques for Chrome DevTools Performance Tab
Once you’re comfortable with the basics, these advanced techniques can help you get even more out of the Chrome DevTools Performance Tab:
- Analyze Long Tasks: Look for tasks exceeding 50ms in the Main Thread. Break them into smaller chunks using techniques like requestIdleCallback or Web Workers.
- Diagnose Layout Thrashing: Identify forced synchronous layouts in the Rendering section, which can slow down scrolling or animations. Avoid repeated style recalculations by batching DOM updates.
- Leverage Performance Insights: Use Chrome’s Performance Insights panel (available in newer versions) for automated recommendations and simplified analysis.
- Monitor Memory Usage: Enable the Memory checkbox during recording to detect memory leaks, which can degrade performance over time.
- Test Mobile Performance: Use DevTools’ device toolbar to simulate mobile devices and analyze performance under different network conditions.
These techniques can help you fine-tune your site for maximum performance, ensuring a seamless experience across devices.

Integrating Performance Optimization into Your Workflow
Optimizing website speed isn’t a one-time task—it’s an ongoing process. Here’s how to make the Chrome DevTools Performance Tab part of your development workflow:
- Profile Regularly: Run performance profiles during development and after major updates to catch issues early.
- Automate Testing: Use tools like Lighthouse or WebPageTest alongside Chrome DevTools for comprehensive performance audits.
- Monitor Real User Metrics: Integrate tools like Brand Nexus Studios’ analytics services to track real-world performance data.
- Collaborate with Experts: Partner with a digital marketing agency like Brand Nexus Studios to implement advanced optimization strategies.
By incorporating these practices, you can maintain a fast, user-friendly website that ranks well and converts effectively.
FAQs
What is the Chrome DevTools Performance Tab used for?
The Chrome DevTools Performance Tab analyzes website runtime performance, identifying bottlenecks like slow JavaScript, rendering delays, or resource-heavy assets to optimize speed.
How do I record a performance profile in Chrome DevTools?
Open Chrome DevTools, go to the Performance Tab, click the record button, interact with your site, and stop the recording to analyze the performance profile.
What are the most common website speed bottlenecks?
Common bottlenecks include unoptimized images, heavy JavaScript, excessive CSS, slow server responses, and render-blocking resources.
How can I optimize images for faster website loading?
Use tools like TinyPNG for compression, convert images to WebP format, and implement lazy loading to defer offscreen images for faster page loads.
Why is website speed important for SEO in 2025?
Website speed impacts user experience and Google’s Core Web Vitals (LCP, FID, CLS), directly affecting SEO rankings and conversion rates.
Conclusion
The Chrome DevTools Performance Tab is an essential tool for any developer looking to optimize website speed in 2025. By identifying and fixing bottlenecks like unoptimized images, heavy JavaScript, and slow server responses, you can create a faster, more engaging user experience. This not only improves user satisfaction but also boosts your SEO rankings and conversions.
Want to take your website performance to the next level? Contact Brand Nexus Studios at morne@brandnexusstudios.co.za for expert website design and optimization services. Subscribe to our blog for more tips on digital marketing and web performance!